
Definition
General Definition Of Pivot Points
What is a pivot point? It is a concept that traders should be familiar with as it is essential to any analysis. It serves as a benchmark for determining the probable market direction in the next session and identifying key support and resistance levels of different assets including forex, stock, and commodity markets.

How are those Points Calculated?
Determining the pivot points(PP) involves calculating past prices for a given period. To do so, analysts utilize several methods, with the most popular ones being Woodie’s method, Classic method, and Camarilla method, which we will discuss in more detail later on. However, before delving into the methods, let’s elaborate further on the pivot points themselves.
A PP is a market turning event that shows price expectations for the next session. If the price is trading above the PP, it indicates a bullish market trend. Conversely, if the price is trading below it, it indicates a bearish market trend.
Pivot points are used to identify key support and resistance levels. The primary support and resistance levels consist of the support levels S1, S2, and S3, and the resistance levels R1, R2, and R3. The S1 support level is the strongest support level and the first level to watch out for when the price is moving down. Similarly, R1 is the strongest resistance level and the first level to watch out for when the price moves up.
Different Types of Calculating Pivot Points
There are three primary types that are calculated using historical prices:
-
Classic
o start with, in the classic method, we calculate by adding the previous session’s high, low, and closing price and then dividing the result by three. This average is used as the main PP for the next day. Determining support and resistance levels is based on additional values that were calculated using previous prices. As for additional levels, they can be calculated using the following rules:
Support Level 1 (2 x classic PP) – the previous session’s high Support Level 2 Classic PP – (high of the previous session – low of the previous session) Support Level 3 Previous Session Low – (2 x (Previous Session High – Classic PP)) Resistance Level 1 (2 x classic PP) – the low of the previous session Resistance Level 2 Classic PP + (previous session high – previous session low) Resistance Level 3 Previous Session High + (2 x (Classic PP – Previous Session Low) 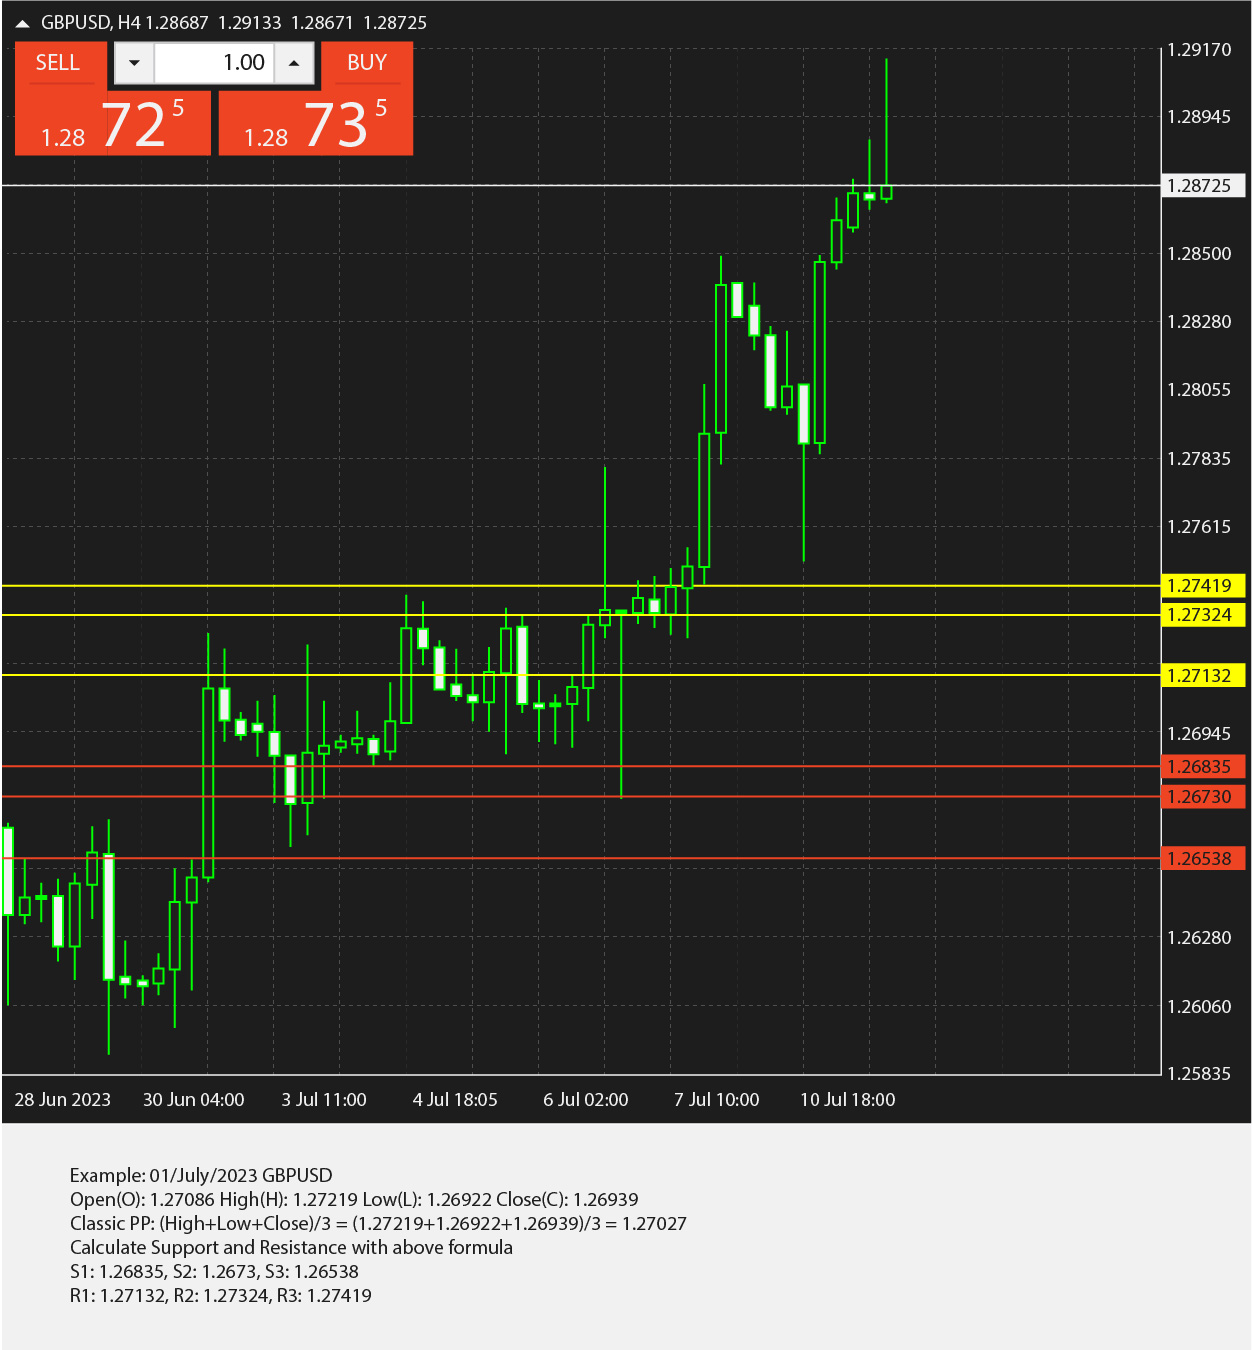
-
Fibonacci
The Fibonacci method is a calculation approach similar to the Classic PP, with the inclusion of Fibonacci levels to derive additional values. Additional levels can be calculated as follows:
Support Level 1 Classic PP – (0.382 x (previous session high – previous session low) Support Level 2 Classic PP – (0.618 x (previous session high – previous session low) Support Level 3 Classic PP – (1.000 x (previous session high – previous session low) Resistance Level 1 Classic PP + (0.382 x (previous session high – previous session low) Resistance Level 2 Classic PP + (0.618 x (previous session high – previous session low) Resistance Level 3 Classic PP + (1.000 x (previous session high – previous session low))PP =(High + Low + Close) / 3R3 = PP + ((High – Low) x 1.000)R2 = PP + ((High – Low) x 0.618)R1 = PP + ((High – Low) x 0.382)S1 = PP – ((High – Low) x 0.382)S2 = PP – ((High – Low) x 0.618)S3 = PP – ((High – Low) x 1.000) 
-
Woodie
Woodie is another method of calculation developed by Tom Woodie, a famous American trader. This method is considered one of the most popular ones. Though similar to the classic , Woodie method differs from the Classic method as it takes into account several factors, such as the current closing price, the previous closing price, and changes in price.
The formulas used to calculate Woodie’s PP are as follows:
PP = (H + L + 2C) / 4
R1 = (2 * PP) - L
R2 = PP + H - L
S1 = (2 * PP) - H
S2 = PP – H + L
Where: C is the last closing price
-
Camarilla
Camarilla is a method of calculating used in analyzing price charts of financial assets. This method was developed by a trader named Nick Stott. It is considered one of the most popular methods of calculating along with the other methods mentioned.
Calculating those points in the “Camarilla Way” differs from the classical method, where the base one and possible resistance and support levels are determined based on the last closing price and the high and low prices of the specified time period. The Camarilla calculation method is based on dividing the daily price range into 8 possible levels, including 4 support levels and 4 resistance levels.
It can be calculated using the following formulas:
Ø PP= (High+Low+Closing) / 3
R4 = C + ((H-L) x 1.1/2)
R3 = C + ((H-L) x 1.1/4)
R2 = C + ((H-L) x 1.1/6)
R1 = C + ((H-L) x 1.1/12)
S1 = C – ((H-L) x 1.1/12)
S2 = C – ((H-L) x 1.1/6)
S3 = C – ((H-L) x 1.1/4)
S4 = C – ((H-L) x 1.1/2)
Example Cases for Calculating these Points
-
Open price is between R3 and S3
Buy when the price move back above S3 after going below R3. Target will be R1, R2, R3 levels. Stop loss can be placed at S4 level.
Wait for the price to go above R3 and then when it move back below S3 again sell or go short. Target will be S1, S2, S3 levels and stop loss above R4.
-
Open price is between R3 and R4
Buy when the price move back above R3 again after going below R3. Target will be 0.5%, 1% and 1.5% . Stop loss can be placed at R3.
Wait for the price to go above S3 and then when it move back below S3 again sell or go short. Target will be S1, S2, and S3 levels and stop loss above R4.
-
Open price is between S3 and S4
Wait for the price to go above S3 and then when it moves back above S3 again go long. Target will be R1,R2, R3 levels and stop loss below S4.
Wait for the price to go below S4 and then when it moves below S4 go short. stop loss above S3. Target 0.5%, 1% and 1.5%.
-
Open price is above R4
Buying can be risky at this level. Wait for the price to go below R3. As soon as the price moves below R3 go short. Stop loss above (R4+R3)/2. Target S1 , S2 and S3.
-
Open price is below S4
Selling could be risky at this level as price has opened with big gap down. Wait for the price to go above S3. When the price moves above S3 buy with stop loss of (S4+S3)/2. Target R1, R2 and R3.